So far each song is represented by several 6-second sequences of the specific loudness sensation per critical-band. It would be
possible to use this to calculate
similarities between the data. One option would be
to compare two sequences based on their point-wise euclidean distance.
The result might be quite surprising. For example, shifting some sequences by only 40ms would result in
a huge difference to the un-shifted sequences - although they sound
the same. Thus, the final representation of the
data must be invariant to time shifts.
1. Loudness Modulation Amplitude
The loudness of a critical-band usually rises and falls several times. Often there is a periodical pattern, also known as the rhythm. At every beat the loudness sensation rises, and the beats are usually very accurately timed.
The loudness values of a critical-band over a certain time period can be regarded as a signal that has been sampled at discrete points in time. The periodical patterns of this signal can then be assumed to originate from a mixture of sinuids. These sinuids modulate the amplitude of the loudness, and can be calculated by a Fourier transform.
An example might illustrate this. To add a strong and deep bass with 120
beats per minute (bpm) to a piece of music, a good start would be to set the first critical-band (bark 1) to a constant noise sensation of 10 sone. Then one could modulate the loudness using a sine wave with a period of 2Hz and an amplitude of 10 sone.
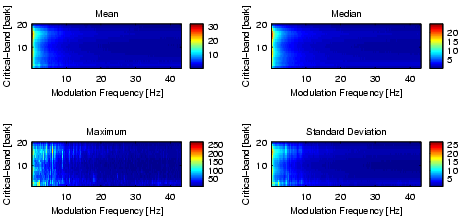
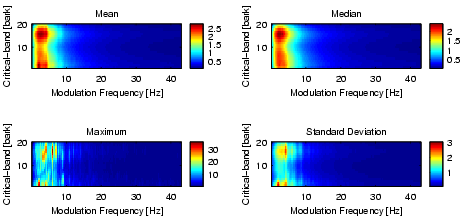
The modulation frequencies, which can be analyzed using the 6-second sequences and time quanta of 12ms, are in the range from 0 to 43Hz with an accuracy of 0.17Hz. Notice that a modulation frequency of 43Hz corresponds to almost 2600bpm. Figure 1 depicts some basic statistics of the data obtained after this step.
|
|
Figure 1: The modulation amplitude spectrum of about 4000 6-second sequences.
|
2. Fluctuation Strength
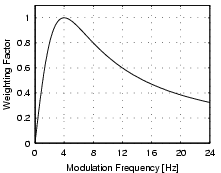
The amplitude modulation of the loudness has different effects on our sensation depending on the frequency. The sensation of
fluctuation strength is most intense around 4Hz and gradually decreases up to a modulation frequency of 15Hz (cf. Figure 2). At 15Hz the sensation of
roughness starts to increase, reaches its maximum at about 70Hz, and starts to decreases at about 150Hz. Above 150Hz the sensation of hearing
three separately audible tones increases.
|
|
Figure 2: The relationship between fluctuation strength and the modulation frequency.
|
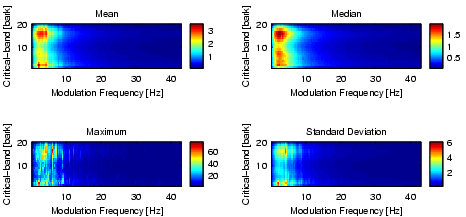
The coefficients obtained from the FFT in the previous preprocessing step are weighted based on the psychoacoustic model of the fluctuation strength. Figure 3 depicts the effect of calculating the fluctuation strength. The modulation amplitudes (cf. Figure 1) are highest at the lowest modulation frequencies. All other frequencies would play a minor role in calculating the distances between two sequences.
|
|
Figure 3: The fluctuation strength spectrum of about 4000 6-second sequences.
|
The fluctuation strength (cf. Figure 3) is spread out more evenly across the spectrum. Notice that the standard deviation shows clear patterns of vertical lines, which are caused by sequences with a strong beat at the corresponding modulation frequencies. Around bark 1 to 3 there are some highlights, these are typical bass patterns.
As mentioned above the highest modulation frequency which can be calculated is about 43Hz. However, music will usually not
show much fluctuation at frequencies beyond 10Hz (600bpm). Figure
3 shows the standard
deviation of the fluctuation strength of all sequences. It rapidly decreases after about 5Hz and there is hardly any fluctuation around 15Hz. The mean, median, and maximum values of the fluctuation strength confirm that there is not much activity beyond 10Hz. To reduce the amount of data only the frequency values up to 10Hz are used, which are the first 60 values.
3. Modified Fluctuation Strength
To emphasize vertical lines gradient filters are applied and finally gaussian filters remove irrelevant information. See Figure 4 for the overall effects on the data set.
|
|
Figure 4: The modified fluctuation strength spectrum of about 4000 6-second sequences.
|
4. Examples
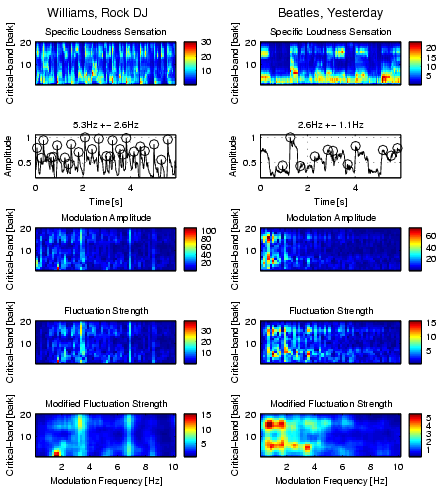
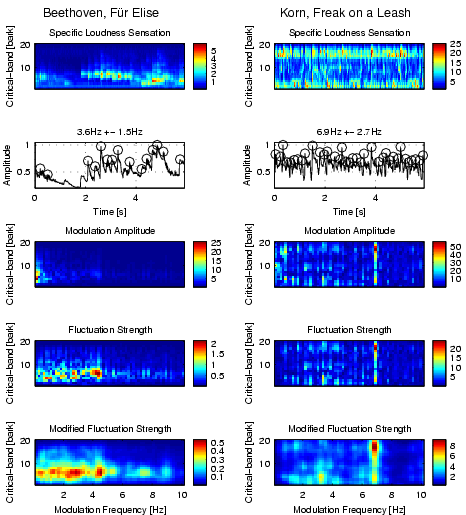
The following Figures 5 and 6 illustrate the preprocessing steps. A detailed description of what can be seen in these Figures can be found in the
thesis.
|
|
Figure 5: The feature extraction steps from the specific loudness sensation to the modified fluctuation strength per critical-band. The 6-second sequences of Beethoven, Für Elise and Korn, Freak on a Leash can be listened too.
|


