What makes up a Horowitz/Rubinstein/Gould?
Similar questions rise up every day in musicology. My goal was to develop a tool that supports users in classifying piano
performances with meaningful visualizations.
The Performance Visualizer uses several state-of-the-art techniques from Information Visualization, like Linked Views, Direct Interaction Widgets,
Focus+Context Visualization, and it supports offline-visualization of musical data as well as synchronized playback and visualization.
In the following, a short overview of the application is given.
First overview, then zoom and filter, then details on demand: Shneiderman's Visual Information Seeking Mantra was one of the guidelines during the
development of the software. The overview/zooming/filtering stage corresponds to the 3D views, while the 2D charts provide detailed information.
Direct interaction widgets: I tried to keep the user interface very simple and intuitive. One way how to reach that goal is (again, according to Ben Shneiderman)
to use direct interaction widgets that allow the user to directly interfere with the visualization domain.
Linking: One performance of a given score can be analyzed simultaneously in several views (the views show the same position in performance/"real" time). Moreover, several performances
of the same piece of music can be analyzed in multiple instances of the application. The applications can be linked over TCP/IP (to support local and distributed
linking transparently), so that they all show the same
positions in score time.
This is an important feature because several parallel visualizations are likely to exhaust
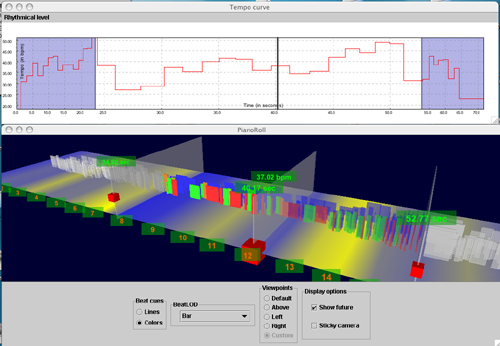
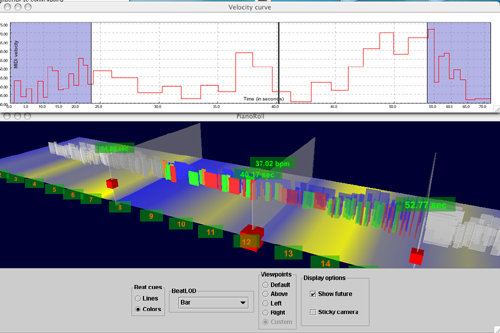
Piano Roll: A well known visualization in musicology and music production is the Piano Roll representation (an "artifact" from the early days of music performance research, where musicologists
tried to analyze music from paper rolls used to steer reproducing pianos). It is used heavily in sequencing applications, and it is well understood by musicians and researchers.
I extended the classical piano roll representation in several ways. First, I embedded it into 3-space, by using the third dimension for encoding of MIDI velocity (louder notes are higher). Secondly,
colors are used to show articulation (staccato or legato playing). Legato notes are rather greenish, staccato notes are shown in red. Thirdly, I tried to visualized tempo on the ground plane of the piano
roll. The first method was to draw the bar lines at their corresponding positions in real time (the wider the space between bar lines, the lower the tempo), the second one was again to use colors. Faster
passages are marked by yellowish colors at the ground plane, blueish colors correspond to slower passages.
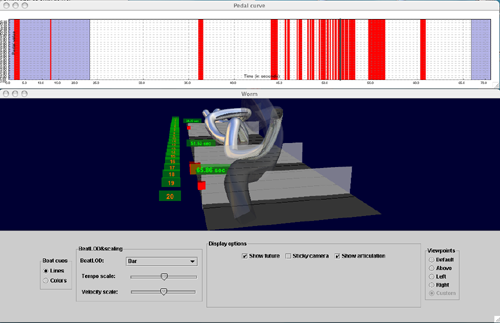
Performance Worm: The Performance Worm is a visualization metaphor developed by the German musicologist Jörg Langner and has been implemented by Werner Göbl and Simon Dixon. It shows the development of tempo and loudness values over time (since I did not use audio data as input to my system, it was not possible to use loudness, I simply used averaged MIDI velocity over all voices), by plotting circle-like shapes at discrete points in time. By fading out points further away in time, a pseudo-3D representation is achieved. I extended this metaphor to a full 3D visualization that allows the user to rotate the worm and zoom into regions of interest. Moreover, articulation is also sketched by modulating the shape of the worm (to achieve this, articulation values are used as control parameters for superellipses, which in turn are used to define the cross section of the worm; the worm itself is modeled with Cardinal Splines, along which the superquadric cross sections are swept).
Multi-resolution tempo visualization (Tempogram): Tempo is computed from the time intervals between two played notes, normalized by the time interval between
the corresponding score notes.
The tempo visualizations allow for interactive selection of the metrical level (Bar/Beat/Sub-beat) that is used for the calculation of the tempo.
Multi-resolution MIDI velocity visualization: Every played note in a performance is associated with a MIDI velocity. To calculate the overall velocity at a certain point in time, the velocities of all active notes at that moment have been averaged (however, this very simple model does not account for masking effects, and it assumes a linear relation between MIDI velocity and perceived loudness). As measuring points for the velocity calculation, the user-definable metrical levels (as in the tempo visualization) have been used.
Pedal visualization: Expressive performances heavily rely on pedal. Pedal values are stored as 7-bit-values (0-127) in MIDI messages, but they are interpreted in a binary fashion by dividing them into values with (<= 63) and (>= 64) (Fig. 3 and 4).
Time range/ROI (Region of Interest) specification: Since audible information is inherently time-dependent, interesting features in music are distributed
primarily along the time dimension. This fact is reflected in the user interface by a simple, yet
effective, principle: Let the user navigate to an interesting point in time, let her or him hear the music at that time, and let her or him constrain the area surrounding the current point of interest.
In the 3D view, the current position and the lower/upper bound of the region of interest can be adjusted with so-called time planes, that can be dragged directly in the 3D visualization domain. In the
2D views, the selection of the user is visualized with an adapted fisheye view-paradigma that magnifies the region of interest (the focus region) and minimizes the context information (see Fig. 1
and 2).
This principle leads in a natural way to a focus+context visualization, the user defines the focus, but the context is still shown as a navigational help.
|
| Fig. 1: A piano roll view with a linked tempo visualization (tempo is computed at the beat level). |
|
| Fig. 2: A piano roll view with a linked velocity visualization (velocities are calculated at the beat level). |
|
| Fig. 3: A worm view with a linked pedal visualization |
|
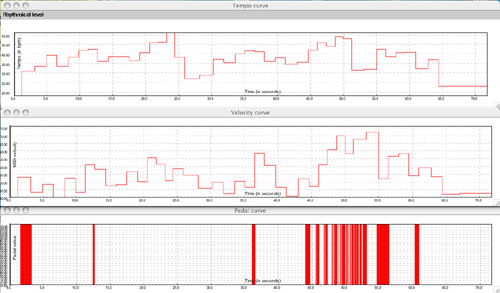
| Fig. 4: Linked 2D views (tempo, velocity, pedal). |