|
|
Demonstrations
There are 4 demonstrations included in the toolbox. For details
on their implementation confer to the source files. Here their
basics are documented.
The demonstrations are
The demonstrations are
- sdh_demo1: Illustration and comparision to U-matrix and k-means
- sdh_demo2: 1-dimensional comparision to histograms, and Gaussian mixture models
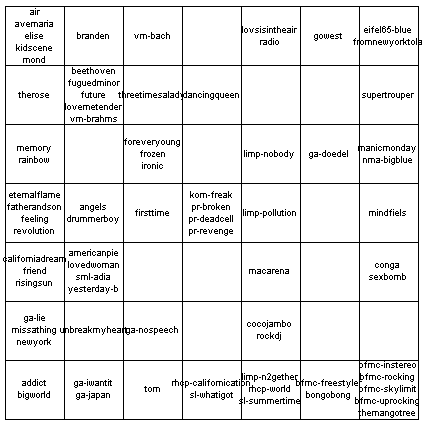
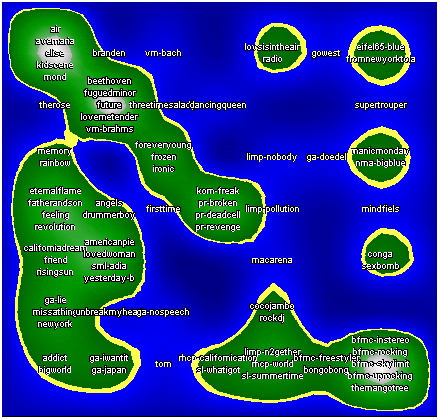
- sdh_demo3: Application to music collection
|
sdh_demo1 The testset for this demo is a set of 5000 points in the 2 dimensional space which are generated by 5 Gaussians. The Probility Density Function (PDF) depicts the 5 clusters and their relationships to each other. The SOM is adapts to the data in the training process so that areas with a high-density are represented by several map units. Furthermore, to preserve the topological structure, some units remain in sparse areas. The 5 clusters can cleary be identified in the SDH visualization (using s=3). The U-matrix shows the large distances between the upper right and lower right clusters. Using k-means (k=5) clusters the units such that each unit cluster corresponds to a data cluster. However, this requires prior knowledge of the number of clusters contained in the data.  | ||||
 | ||||
|
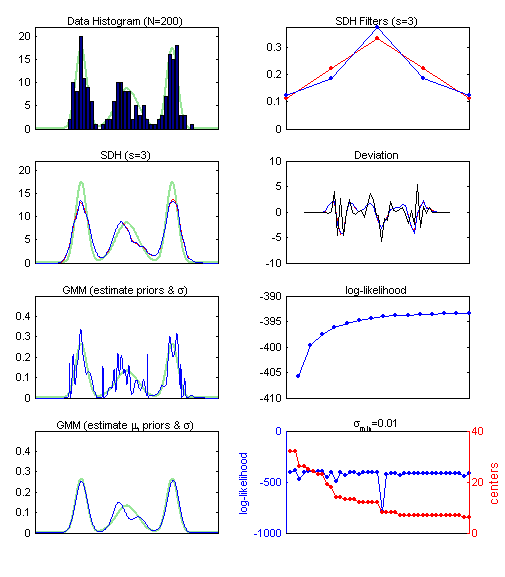
sdh_demo2 The testset for this demonstration is 1-dimensional and generated by 3 Gaussians. The PDF is visualized in green. The subplots from left to right and top to bottom illustrate: (1) a simple histogram of the data; (2) the SDH filter functions "ranking" (red) and "1/n" (blue) for s=3, note that there is not much difference; (3) the SDH of the data using the bin centers as "model vectors", (red is "ranking", blue is "1/n"; (4) the deviation between the SDHs and the histogram (black); (5) a Gaussian mixture model (GMM) where the centers (mu) are fixed to the bin centers, the variance and priors are adapted using Expectation Maximization (EM); (6) the log-likelihood function for the iterations of the EM; (7) a GMM where the centers are initialized according to the bin centers and are adapted using EM, center is removed if its standard deviation falls bellow 0.01; (8) the log-likelihood function for the GMM with adaptive centers, and the number of centers, which decreases as centers collapse and their standard deviations becomes too small. The problem of visualizing the cluster structure from given bin centers is basically the same as to visualize the cluster structure given a SOM (and its model vectors). A comparision between subplots (3) and (5), i.e., between the SDH and the GMM with fixed centers explains why it is easier to use SDH. Note also that the computational cost for GMM-EM is much higher than for SDH.  | ||||
 | ||||
|
sdh_demo3 This dataset comes from the project "Islands of Music" see www.oefai.at/~elias/music/demo for details.   | ||||
 | ||||

